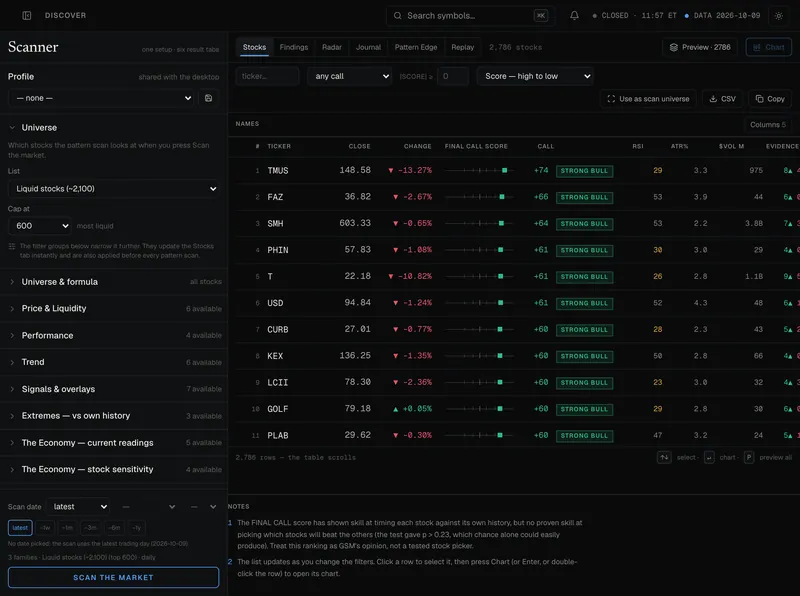
Scanner
Scan the liquid universe for 66 chart patterns and dozens of filters, ranked by the Final Call. Its own footnote says what that ranking can and cannot do.
Gavano Sabacci’s Moneymaker
Every liquid US stock, read every trading day. Patterns, levels and options walls already drawn on the chart, sector rotation, the economy, and one verdict per stock with its record beside it.
Charts
Open a symbol and the work is already on it. Patterns are found and drawn with their necklines, levels show how many times they held, and the options market’s call wall, put wall and gamma flip sit on the price axis.

Force
Force takes one stock’s Final Call apart. Every indicator becomes a point on a landscape: the higher it stands, the harder it pushes the score up, and below the floor it pulls the score down. Indicators that move together sit together.
Press play to walk through the past year day by day with the price beside it, or turn the landscape by hand.
RRG Rotation
The 11 sector ETFs against SPY, QQQ, IWM or DIA, weekly or daily: leading, weakening, lagging, improving. Replay the rotation through the years, then click a sector to open its industries in a second graph on the same clock.
Your watchlist, or any list of symbols, rotates the same way.
Dashboards
Every panel in GSM has a star. Star it and it lands on your dashboard, live. Start from a template (a morning routine, one stock, the economy) or from nothing, and keep up to twenty.
Aim a dashboard at a symbol and every card on it follows.
The desk
One price database and one engine behind every page, so a number on the scanner is the same number on the chart, in the backtest and in the morning digest.
Scan the liquid universe for 66 chart patterns and dozens of filters, ranked by the Final Call. Its own footnote says what that ranking can and cannot do.
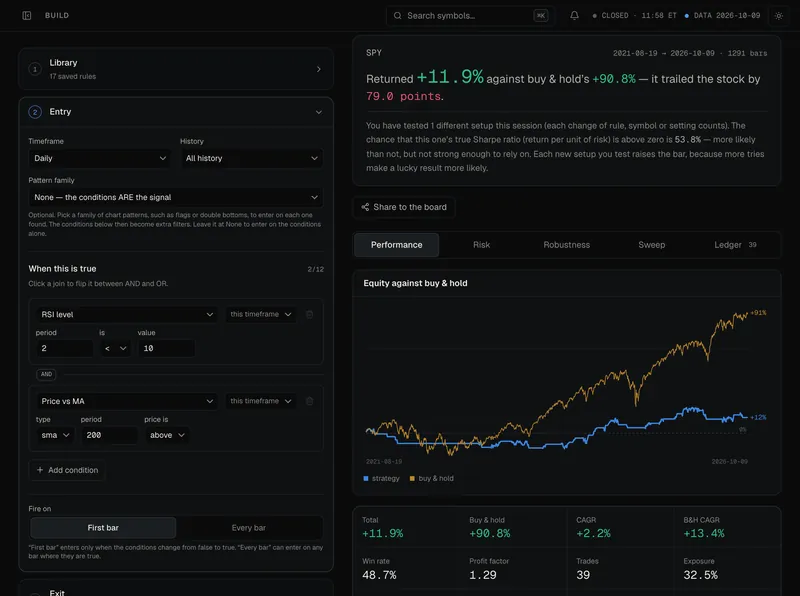
Build a rule from conditions and backtest it on a stock’s whole history. Entries fill at the next open, a gap through the stop fills at the gap, and it tells you how likely the result is to be luck.
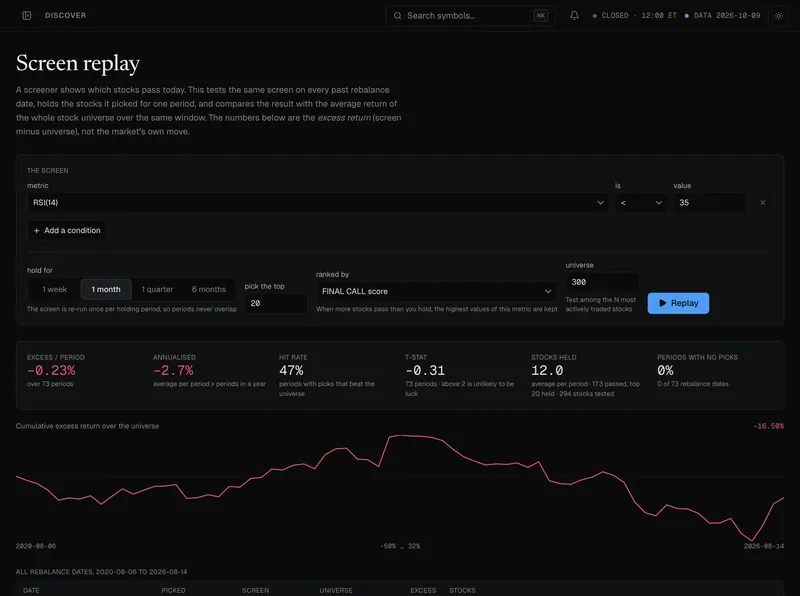
Run a screen on every past rebalance date: what it picked, and how that did against the whole universe over the same window.
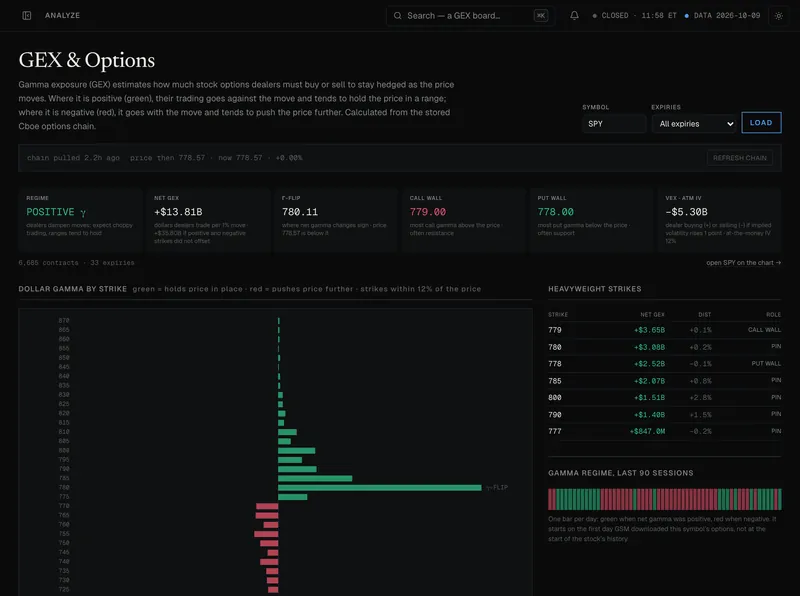
Dealer gamma by strike from the options chain: the call wall, the put wall, the flip, and the gamma regime for the last 90 trading days.
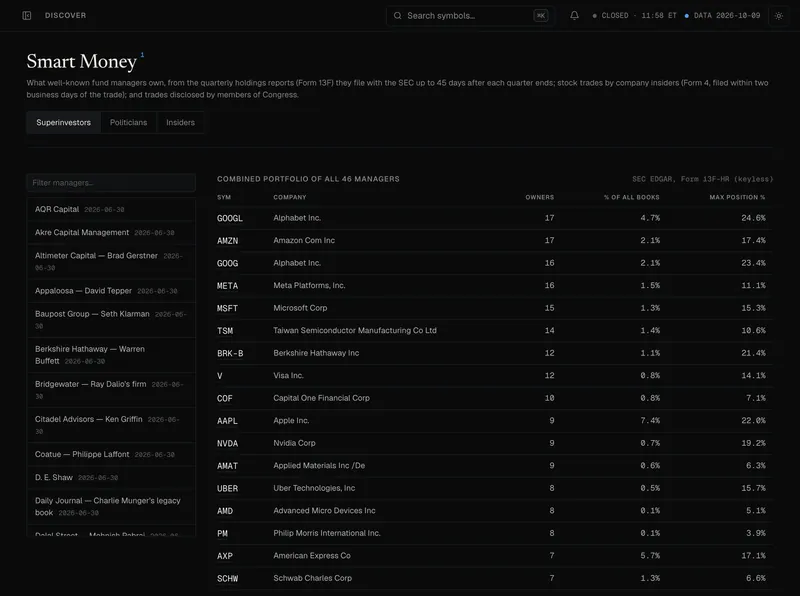
The combined 13F portfolio of 46 well-known managers, trades disclosed by members of Congress, and insider filings, straight from the SEC.
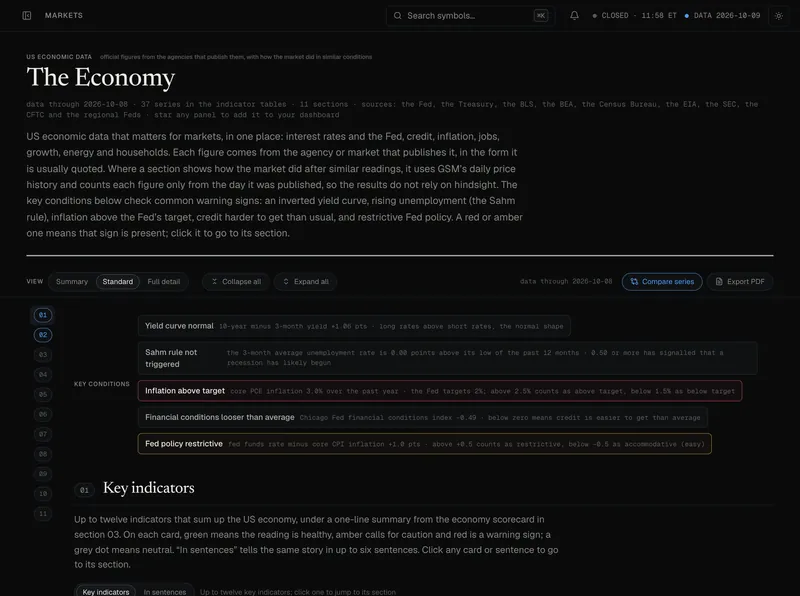
37 series from the Fed, the Treasury, the BLS, the BEA, the Census Bureau, the EIA and the CFTC, with the classic warning signs checked for you.
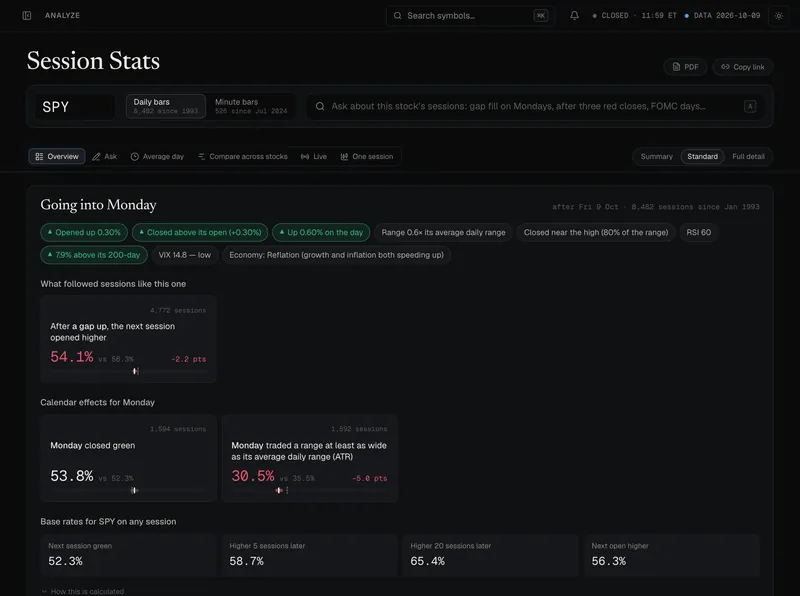
What followed days like today, for any stock, next to the base rate: gap fills, day-of-week effects, opening ranges.
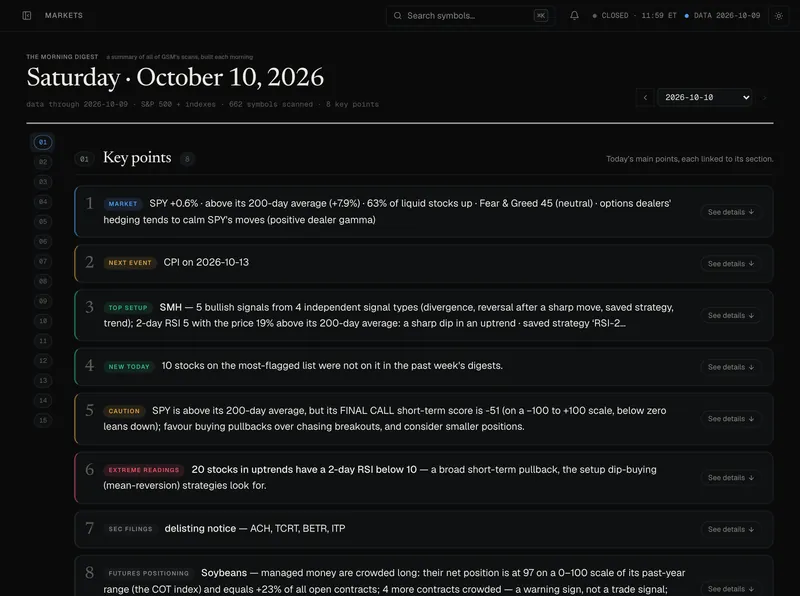
The day on one page: the market, the next event, the strongest setups, extreme readings, SEC filings and futures positioning, each linked to its section.
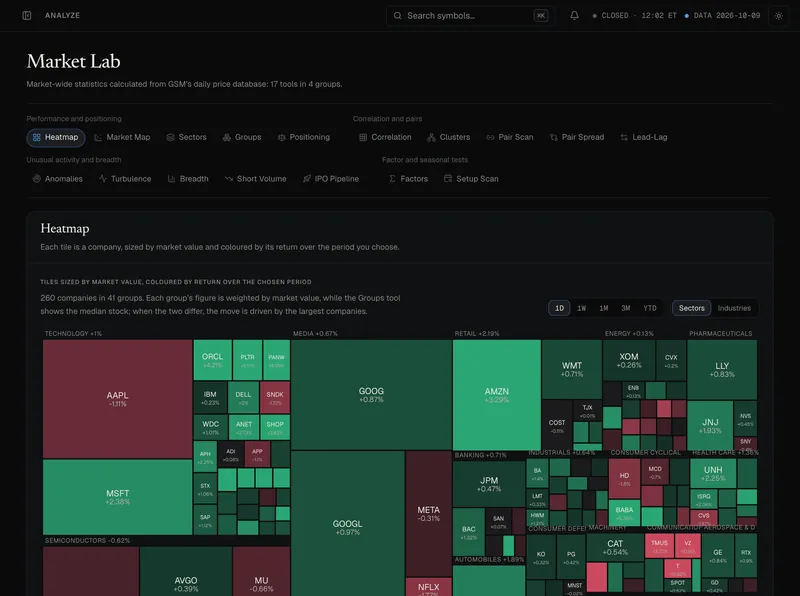
17 market-wide tools: heatmap, sectors, correlations, clusters, pair scans, a factor board, breadth, turbulence, short volume and the IPO pipeline.
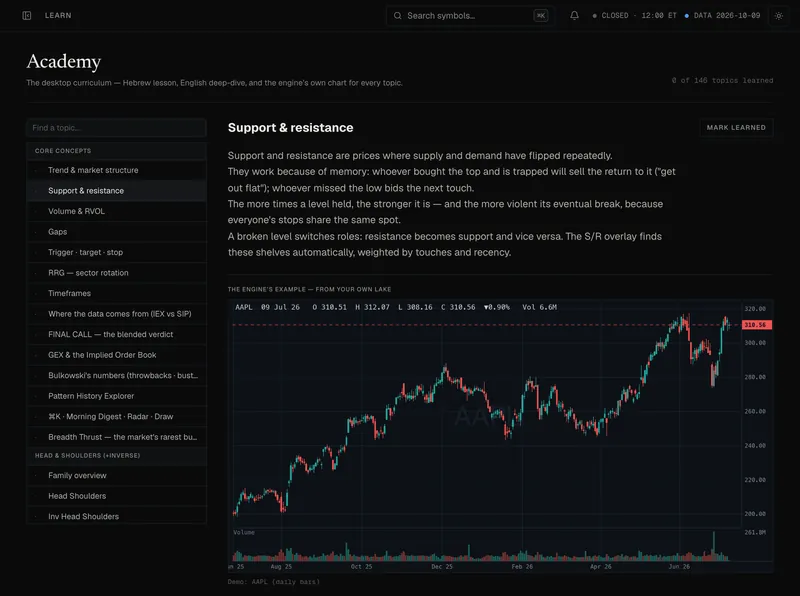
140 topics, each with a Hebrew lesson, an English deep-dive and the engine’s own chart of the idea at work.
Price and event alerts, and live rules: a strategy you backtested, switched on and checked against every new bar with the same logic.
Publish a strategy and GSM re-runs it and ranks it by how likely the result is real. Arenas lock every entry before scoring starts.
Your names with their alerts and verdicts, and the earnings calendar for the stocks you follow.
The record
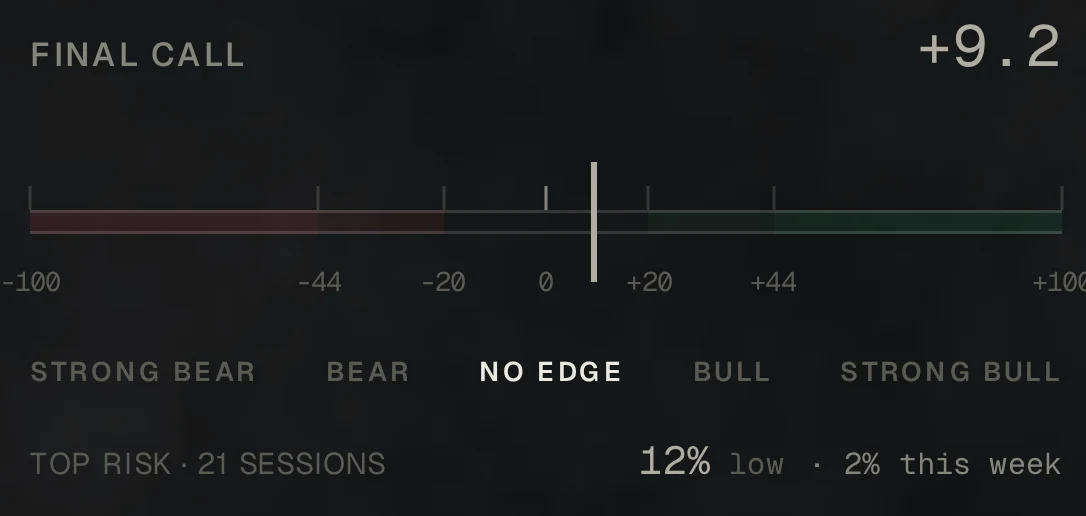
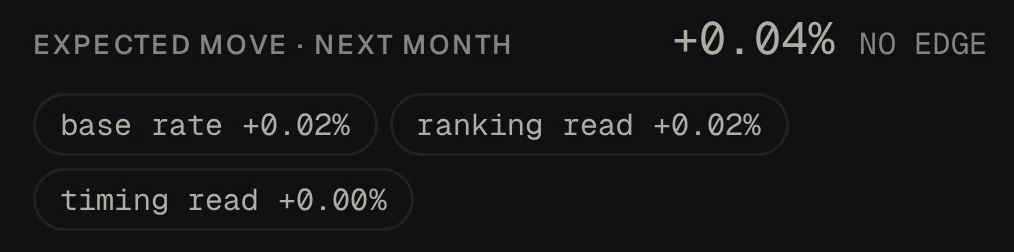
A percentage on its own tells you nothing. GSM puts the base rate beside it and the count above it, so you can see whether the edge is real.
So a gap up makes a higher open less likely, not more. Without the base rate, 54% reads like an edge.


Data
12,000+ US-listed symbols, searchable by ticker or company name, with daily history back to 1992. Economic data comes from the agencies that publish it.
Access
Access is by request while the group is small. Tell us what you trade and what you use today.
or write to [email protected]